What business skills do finance professionals need in 2021?

What is on the CFO agenda in 2021 and how will it shape your role as a finance professional moving forward
The questions are many right now as the role of the CFO and the finance team is changing and as the change is happening at a fast speed.

Put in short in 2021 the finance function is expected to play a much more dynamic role in driving both innovation and strategic decisions and this undoubtedly calls for new skills, and new ways of thinking. And to support this new technology is the answer. It is the answer to becoming more innovative but it is also the answer to becoming more strategic.

You can compare the technological changes that we are seeing in finance right now to the technological development we have seen in the music industry.  

In the music industry we moved from LPs to CDs, iPods and MP3 players to now streaming music on our smartphones though only streaming services. The change (that happened gradually in the music industry) is the same we see in finance today. The only difference is that it took around 20 years for the music industry to evolve into where the business is at today. So, within the music business employees were able to adjust to each change and step little by little. 

When looking at finance the change – is happening much faster.
There is nothing gradual about it.

How do you make sure you are keeping up to speed and staying relevant within the new finance department? 

The speed of change can be quite daunting. Not only is the change happening quickly but you as a professional, your skills and competencies must evolve at the same paceThe finance team is relied upon as a trusted business partner. It is crucial that the leading management knows if they are making the right decisions on behalf of the entire organization. That is why they need the finance team to produce and present financial insights that validates what the next move should be for the business.  

The finance department is as a result becoming drivers of data drive decision making. It is no longer enough to sit behind your desk and crunch numbers all day long. You have to present insights, thoughts, rational thinking, and conclusions which the leading business management can relate to and use for decision making.

To produce what your management need and to stay relevant when the technological wave hits the finance department, you will need to get out of your comfort zone as a traditional CFO or finance professional. 

How does the classic profile of a finance professional align with the new requirements? 

To understand how you step outside of your comfort zone let us first take a look at how the traditional profile of a finance professional looks like. 

For this we have looked into the personality test tool Predictive Index that we use to understand both how we put together people and teams to understand specifically what drives behaviors at work. 

After a thorough analysis of millions of Behavioral Assessments, the predictive index science team has identified 17 “Reference Profiles” that create a behavioral map for different types of people. 

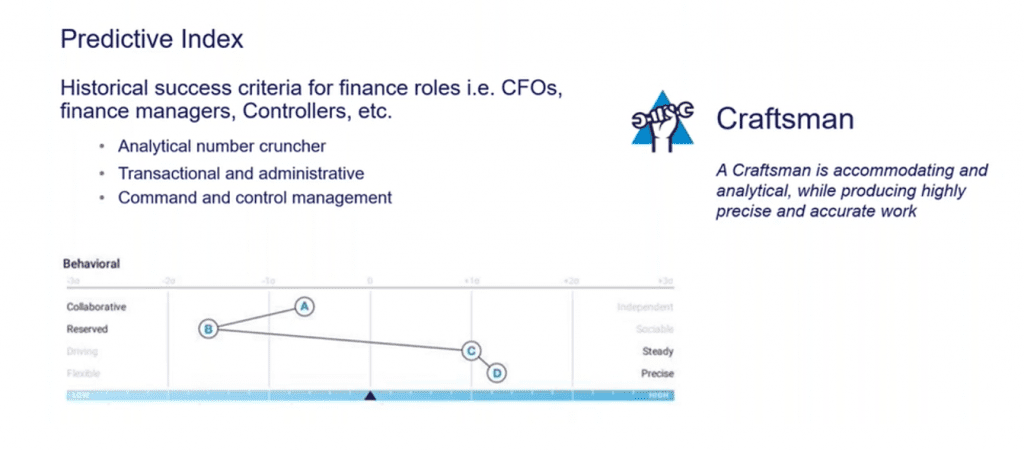
The classic profile that we see in finance professionals is the profile called the Craftsman.
The Craftsman has a high set of analytical skills, loves to produce precise data, is detail oriented, loves control, and to has a steady and comfortable way of working.  

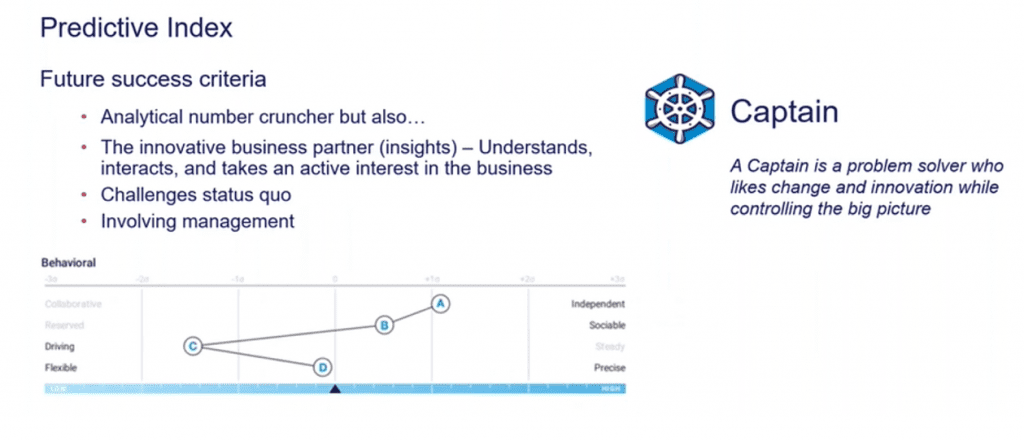
But to accommodate the changes we are now seeing occurring we also see the skillset of the finance professional starts to shift towards the Captain profile.  

The Captain profile is a problem solver, likes changes and innovation while controlling the big picture. This profile still needs to be analytical, but also needs to understand how to be interactive with the wider business and deliver insights into the organization.  

To better understand how you can be an asset to your business here are some steps you have to keep in mind for changing the way you think and work as a finance professional today. 

To become the finance professional of tomorrow (the captain) you need to: 

  1. Get out of the reactive mindset of finance and start to be more proactive in your thinking. 
  2. Report on what is happening (or what might happen)rather than just reporting on what has happened.  
  3. Deliver insights, not reports. Insights is when you have information which your leading managers does not know about, but which can help them make better decisions. Reports is loads of columns with numbers in. You need to know the difference. 


You also
have to move from spending most of your time on accounting and reporting, data and transactions (and it is here new technology comes into play to support you) to spending more time on insights and influence, analyzing and forecasting. Data, reports and analysis are important because you cannot be a finance business partner without the numbers and the data to back up your insights. But where you can really make a difference is when you share these insights, make recommendations, and influence the management’s decisions so they make better decisions and execute better. 

As with any other major changes you can do it all over night, it all starts with micro steps. The idea is that you break your plan into minor bits and create sub goals and implement micro steps of the week, so you see a result little by little and not just at the finish line after two- or three-years’ time. Not to see any progress can be very demotivating so break it down into so small bits, so you can see yourself moving closer to the overall goal. 

Have you ever tried to implement a new digital system or tool in your finance department?

Then you know how difficult it can be for your colleagues to adapt to using a new system, new procedures, and new habits.

To digitally implement a new tool is one thing but implementing it in everyday life at the office and getting your colleagues to use it is a completely different story.

When looking at the adaptation aspect of digitization in the finance function, nudging becomes an interesting method to consider.

If you want to know how you can accelerate digital transformation in your finance department and successfully implement new software tools, this blog is for you!

Nudging in a nutshell

Before we start explaining how to use nudging for accelerating your digital development, let us first explain what nudging means.

The term nudging covers the cognitive and psychological method of successfully and quickly creating a change in certain behavior. Nudging means guidance: Just like an elephant mother uses her trunk to guide her young calf to go in the right direction, communication and design can guide humans to make the right decisions.

Nudging originates from a political arena and is a way of defining our surroundings. It is a method for you to make measurable changes in people’s behavior within a certain group or area.

It is all about ensuring the right decision is an easy one to make. Let us look at the cognitive way to achieve this goal.

How to accelerate behavioral change in your department

When trying to implement new elements, systems, or procedures to the workflow, it’s imperative to get your employees on board with your idea of doing things smarter.

But it can be hard to adjust to new methods since we humans are very comfortable beings and like to do things as we have always done them. Thus, changing habits is a tough task.

To be able to change behavior, we need to look at how the human brain works. The human way of thinking is divided into two systems.

System 1:

  • System 1 is used 90% of the time.
  • System 1 requires no conscious consideration; you can almost say it is an autopilot system for the brain that relies on habits.
  • System 1 is the system we use when we quickly determine if an object is close or far away, if we have to answer to what 2+2 is, or when we react instantly to a terrifying photo or film.

System 2:

  • System 2 is used 10% of the time.
  • System 2 requires conscious consideration; you focus and concentrate a lot on the task at hand when thinking in system 2. Using your brain this way requires a lot of energy from you since you cannot rely on habits to solve this task. This is also why you cannot be thinking too long in system 2. Eventually, you will be drained of energy and need to recharge.
  • System 2 is the system we use when we have to come up with creative solutions to a problem.

In summary, to accelerate behavioral change towards digitization in your finance function, you need to communicate to your employees’ and colleagues’ system 1. It will make it easy for them to act and change behavior, opposed to if you communicate to system 2 which demands too much of the human brain to adapt to new work methods.

Implement guides and clues towards behavioral change into your daily routine

You should ask yourself: “What are the daily routines? How do we find a tool, develop a new procedure, or create a workflow that integrates well into this routine?”

Once again it is all about understanding that nudging is based on human instinct. So, when guiding your colleagues to make the right decisions, you should consider, how to make the right decision the easy decision to choose.

You can look at what makes your team engaged and how you can use those aspects in every day working life to change behavior, so they will use the new tools instead of going back and do things the old way out of habit. Let’s take the issue of low meeting attendance rates and see how guides put in the daily routine can improve this issue. An easy change to implement is to put in small reminders that will remind your colleagues to attend follow-up meetings. Even the smallest reminders will help support the change of behavior and gradually everyone in your team will adapt to the new working method. When you know how to implement new working methods into the daily routine, it is time to create the communication and design that is in line with what you have observed. It is through these means the real behavioral change is going to happen in your finance department.

To learn more about how to put together the right communication and design for guiding your team towards the right decisions, watch the webinar “How Nudging Can Accelerate Digital Transformation in Finance” today!

On the 17th of May, employers can finally welcome employees back to the office in the UK!

But while we’ve been working from the home office for the past 12+ months, a lot has changed. There will be a different working environment with new requirements that we are now stepping into.

If there is anything the recent lockdown has taught us, it is that as finance professionals, we must be able to adapt to unforeseen circumstances which means the CFO has to adopt an agile mindset. Agility and adaptability must also come into play when reporting and presenting recommendations based on financial insights. In times where everything moves fast and changes rapidly, the financial state of your business can also suddenly change from one day to the next.

As a result of this, financial insights have never been more critical to your business than they are now! By being agile, you will be able to deliver reports and recommendations needed in time for your management to act on the data. And this is where the true value of the finance function lies and what will determine how successful you will be in 2021.     

But how can you deliver fast, reliable financial insights in times where everything can change tomorrow?

The answer is simple; by optimizing the way we work in finance.

If you want to stay relevant as a CFO, here is what you need to do:

Adopt an agile mindset

It is no longer enough for the finance department to deliver data that describes what has happened to your company financially. Now, you need to provide data that describes what could and should happen.

During the lockdowns this past year, we have seen an increasing need for changing reporting, forecasting more frequently, and getting new information. You always had to act fast and deliver insights swiftly because if you waited, the situation could be completely different the next day. This is where the agile mindset becomes essential. If you don’t have the ability to adapt to the changes the past year have brought to the world of finance, you will lag behind.

Digitization and automated processes are becoming the new normal because management needs you to deliver real-time insights and recommendations instead of being a number cruncher. Digital tools reduce time spent on financial consolidation and reporting, for instance. This is the reason why digital tools will play a big role in the work of finance professionals to get their jobs done in time.

Build up new skills to stay relevant

As reporting requirements are changing, so is your role as a finance professional, and this ultimately means that you need to focus on developing new skills to stay relevant. You should continuously cultivate your analytical, leadership, people, and business skills to become more agile and increase your performance in an environment that requires you to adapt to new and unforeseen circumstances quickly. Below, you see the skills you as a CFO should focus on building up in 2021.

  1. Analytical skills: These are the finance professionals’ home turf. The analytical skills are probably where you consider yourself strongest. You have practiced these skills since your student years and built a solid, professional toolbox. But you can always extend the toolbox, so you are well informed of the latest trends and tools.
  2. Business Skills: If you learn to understand the business you are working in, you will be able to speak the same language as your business shareholders, meaning you will effectively communicate what financial data means to the business.
  3. Leadership skills: To effect change in the finance function, the CFO must take leadership of implementing changes by, for example, building up employee’s professional skills to drive the team forward.
  4. People skills: Working and communicating with people is becoming an essential part of being a CFO. The big change lies in how you and your team should work and communicate going forward. You must shift from communicating what has happened to communicating what can and needs to happen, and as the CFO, you must be the facilitator of this change. Read more about skill development here.

If you want to know more about how you should work to optimize your skills at as a finance professional to succeed driving proactive decisions, join us for our webinar “The CFO Agenda for 2021: Skill changes, key competencies, and value drivers” on the May 20th. Sign up here!

The challenge of using multiple ERP systems for your consolidation

One of the biggest challenges group finance professionals run into in consolidation is the use of different ERP systems in different entities of the consolidated group. So, if you are one of those stuck in this situation before you do anything else read this blog and learn how you deal with the issue and work around it.

Why did you end up in this situation, to begin with?

First, let´s start by looking into why so many in group finance end up in this challenge and, why most didn’t foresee this in the first place and made sure to steer away. Well, here’s a guess:

When you set up your accounts in your different entities, you have a couple of obvious options, to begin with:

1) You copy/paste the chart of accounts from one entity to another. Easy, and you ensure the same chart of accounts in the different entities.

2) You ask your local accounting department to set up your chart of accounts. Here, you often ensure compliance with local requirements, because of the involvement of subject matter experts. Certain countries have particular mandatory requirements for a chart of accounts, and you don’t want to be non-compliant from day one, of course.

Either way, things often have a habit of o changing over time!

Even if you went for option 1 above, where you copy/paste the chart of accounts from one entity to another, you see additions, changes, or deletions of accounts, and in a few years’ time, chances are that the chart of accounts will look quite different from the outset.

The trouble with local chart of accounts!

Local chart of accounts are convenient when complying with local requirements. If you asked a local controller, auditor or advisor to help you set up the chart of accounts, you get exactly that local subject matter expertise, which makes it easy to set up your statutory financial statements, your local taxable income statement and other types of local reporting.

However, for consolidation purposes, you may be looking for something completely different: here, it is the accounting principles and structure of the parent company, which guide the requirements. Revenue or cost in the consolidated accounts may mean something completely different than revenue or cost in local, statutory financials.

Let´s look at two examples to illustrate this point:

  • A factory preparing local financial statements with a profit and loss account showing Sales, Cost of Goods Sold; Selling, General and Administrative Costs (SG&A), Depreciation, etc. is considered a mere Production entity in the consolidated financial statements, with all costs going to Cost of Goods Sold, and all sales are eliminated anyway (as intercompany sales). Really, this is an example of the difference between organizing the profit or loss statement by function of expenses.

  • Are losses or gains on investments included under Financial items, or under Other Comprehensive Income? Here, you would often see differences in classification between entity financial statements and consolidated financial statements.

Multiple examples can also be found in the elimination process: intercompany balances are offset, goodwill is reclassified, intercompany transactions reversed, etc.

The easy solution

Certain ERP systems allow duplicate account numbers;

  • one set of account numbers for local, statutory accounting
  • one set for the consolidation process and the consolidated financial statements.   

However, you may not be that fortunate, especially if you didn’t go for that somewhat expensive ERP system.

So how do you ease your consolidation, if you are stuck with a different set of accounts without looking at another (expensive) ERP system?

1) Acknowledge that you simply have different sets, and then use a consolidation tool that corrects the accounting IN (and not BEFORE) the consolidation process.

2) Accept that it’s a never-ending story to maintain aligned charts of accounts and to balance local requirements with the requirements in the consolidation.

3) Build your consolidation on top of your ERP with a consolidation software.

In this way, you can have as many different sets of accounts as you have reporting entities, and still come out with the right consolidation. You simply map whatever local set of accounts to where they belong in the consolidation, and then you upload ERP data straight into the consolidation software: your mapping will make sure that everything ends up in the right place in the consolidation!

Of course, you may add, change, or delete an account now and then, but then simply map the added account as well – it’s a one-off step you need to take; after that everything is back in place. When using Konsolidator as a consolidation solution on top of your ERP system it will let you know immediately, if an account is not mapped anywhere, or has been deleted.

Even if your group is not that big, the advantages of a system outweigh the costs, even compared to a plain vanilla spreadsheet consolidation setup which we most often see that small groups start out with (until it becomes too complex). Especially for SME’s who only does the consolidation once a year, that makes it even more difficult to remember those different sets of numbers and therefore even more relevant with a standardized tool to support the consolidation. A consolidation tool will help you overcome those difficulties which – by the way – are even bigger when having to work with different ERP systems and different chart of accounts in all entities.
Why not get started on a formalized structure today, and get a quick preview of how this can look in Konsolidator.

Make optimal use of your data with Power BI, and make an impact

High-level reports are crucial to get a clear overview of your business’ finance, and the relationships between all your strategic measures.
But the value of your data depends alone on your ability to communicate it’s story in an efficient way.
If you are not successful in communicating your data right, it will lose it’s value.

That is what happens if you present your data in long-winded tables with lots of numbers. The opposite is what happens when data is sorted, arranged, and presented visually (in Power BI). This makes is easier for the human mind to comprehend, and therefore also easier to make fast, data-driven decisions.

And that is what you (and your management) want!

Unfortunately, neatly presented data isn’t always what happens in the real world. 
Regardless, if management relies on it or not.

So, let’s talk about data visualization and how you use it for your management reporting to provide the necessary and relevant information needed to run a great business.
Both on the strategic level and the operational level.

And let’s talk about how you provide more strategic knowledge that support the strategic goals.

Look at these two types of reporting and ask yourself this;

1) How does this apply to my own data?
2) How easy do I make it for management to identify trends, patterns, and outliers within my data sets?

The right information brings knowledge. And knowledge is power.

But data alone does not give you (or anyone else) power to make strategic decisions. You probably already know this but sometimes we need a visual picture to fully realize it. And that is why showing data to business stakeholder in long-winded tables and with lots of numbers is a no-go!

For this Power BI truly is your (free virtual) friend!

And as music to any finance professionals’ ears, Power BI is an inexpensive and tangible tool you can access right now! It is a logical extension of Excel, so a tool you as an accountant can easily turn your hands to.

The power of Power BI for complex financial data

Power BI turns your complex raw data into actionable insights to help you avoid erroneous strategic decisions to help you;

✅ Identify hazards and areas that perform poorly
✅ Uncover Hidden Patterns
✅ Illuminate New Potentials
✅ Discover the latest data trends
✅ Gain speed in the data to insights process

And that is how your reporting becomes powerful and how you can support strategic decisions.

Get the maximum output of your data with Konsolidator and Power BI

So, now that we have touched Power BI on a high level lets look at how you do it in practice.

There are 4 ground pillars in good management reporting;

  • Data collection, consolidation, and sorting of relevant data.
  • Analysis, of the relevant data.
  • Visualisation – the act of showing data in a more digestible and user-friendly format.
  • Insights, more effective and fact-based foundation for management´s decisions processes

Konsolidator supports you in all 4 steps and makes the data journey from consolidating data to visualizing it is simple once you have gathered all your data in
Konsolidator´s data warehouse.

The journey looks like this;

  • You connect your data from your Konsolidator data warehouse to Power BI
  • You process it
  • You visualize it

With Konsolidator as a consolidation tool on top of your ERP system we help you automate your consolidation and ensure that your data is reliable and accurate.
Anyone knows that your reporting is only as good as the data that it is built on. So, ensuring accurate processes around data registration is the very first step in providing efficient management reporting.

Whether you use Konsolidator or a different tool the purpose is the same – you need to spend more time on providing decision support end less time on controlling the reliability of your data, and you can only to that if your data processes and reporting are not too manual and time consuming.

Power BI is an integral part of Konsolidator.
This means that Konsolidator extracts your data from your ERP system, consolidates them and enables you to visualize them after and select dashboard representations with filters, pulling complex financial data into a format the non-finance professional can interpret.

In this way accountants can also share consolidated results with the click of a button across stakeholders and you can schedule data refresh at month end to increase efficiencies and drill down into the details.

Analyze your data from Konsolidator with Power BI

The advantages of using Power BI with Konsolidator are many.
To give you a clear picture of what it means for your daily work here are some of the main differentiators that will boost your reporting;

✅ Data is continuously updated as you get new data into your Konsolidator Data warehouse
✅ Power BI supports live connection
✅
Your data is easy to share with others
✅
Large amounts of data can be processed quickly
✅
Power BI can connect to different data sources simultaneously
✅
You get interactive visualizations instead of dead excel sheets 

If you are not currently using Power BI and being asked to deliver faster management reporting, right now you need to look to what tool(s) could enhance your capabilities in the areas of data visualization and analytics.

And here the combination of Konsolidator and Power BI is particularly strong.

Losing speed, power, and strength are likely to be some of the experiences that (unfortunately) best describe the years of lockdown and remote work. Even using a word like turbulent to describe the past year seems almost an understatement. But none the less does it prove the importance of making sure you maintain control over the steering wheel.

Switching off reactive management mode and mapping your priorities

The first step in switching off reactive management mode, hitting the re-set button, and regaining momentum are to use your reflection on the past year. How you map out your priorities for the upcoming financial year is the most impacting task. Thus, you can ensure to constantly take the appropriate actions.

A smart move would be to start by looking at your data processes and ensuring they operate effectively.

Begin by asking yourself what the most prominent struggles were during the various lockdowns and what has changed.

  • What caused you the most trouble when making strategic decisions?
  • What barriers kept you from delivering the required insights?
  • What caused you delays and why?
  • Were you able to gain access to your data at the speed of your decision-making, or did you stall decisions?


The correct information brings knowledge…

…And knowledge is power. But do you know what the accurate information is, and if so, do (or did) you have access to it?

Covid-19 has made it fairly obvious who is losing power – the companies operating on obsolete locally installed systems. These systems make it difficult to be agile and stay up to speed. Especially, as many are now working remotely and handling tasks online.

On the other hand, the winners are companies with integrated systems and easily accessible through the cloud (like Konsolidator).

If you don’t count yourself in this group, surely the way you have organized your systems/workflows have proven to be a risky strategy. But fortunately, this also means you have a lot to gain just by changing how you operate. If you struggled when the speed of requirements and insights accelerated, you should change. It is evident that you need new systems to support new requirements.

Every process is either working or not.

By continuing the same path as before, it is difficult to be able to catch up. Competent finance professionals will acknowledge that cannot recover from the weaker spots in their workflows

So, make a list of how you can change by doing something different.

Admit what was/is broken so you can fix it (sooner rather than later).
Once you start assessing your workflows and reflecting on their performance, it will become obvious which areas need the most attention and where your urgencies lie. This insight is the key to taking back control and looking forward to scenario planning, forecasts, and minimizing your exposure to reoccurring risks.

Look at your systems
  • Can you connect remotely?
  • Are they interoperable?
  • Are they installed locally on your device, or can you access them from your web browser?
  • Do they allow you to get access to your data at the speed of your decisions?
  • In which business areas should you look for a replacement tool for your current?

Your data is the main driver for strategic decisions, so looking at your data will undoubtedly inform your next priorities.

One example is those tasks that rely on shared Excel spreadsheets – the remote working environment has probably given the death blow to those once and for all. Trying to work efficiently in shared spreadsheets has never really been ideal considering the far-reaching type of errors that are common to these Excel spreadsheets like:

  • Formular errors
  • Copy/paste errors
  • Deleting notes
  • Typos
  • …(feel free to add more yourself)

If you are a company for whom the Excel nightmare blew out in full force during these last couple of years, you need to re-think how you handle tasks. Going through the methods you need, and the systems you currently are using should be your priority if you want to prevent the challenges you have just experienced.

Otherwise, you will undoubtedly (continue) to spend valuable hours and days on time-draining tasks like administering spreadsheets, reconciling the numbers and calculations, and adjusting formulas, instead of on value-adding activities such as providing agile insights to your enterprise.

If you want to gain momentum and be more strategic, you have to be proactive, and that you can only do if you implement tools that help you ensure correct numbers and give you back time to analyze your numbers rather than being stuck in the production.


Can you be data-rich but knowledge-poor at the same time?

Now that we have covered where your data comes from and how you can work to improve your data flow, we will round off by taking a moment to look at your financial report as the last step in how to drive strategic decisions.

One thing is having access to data; another is knowing how to use it correctly. And therefore, yes, you can easily be data-rich and knowledge-poor at the same time.

Data, reports, and analysis are essential because you cannot make insights and financial statements without the raw numbers. Where you make a difference is when you share insights, make recommendations, and influence the management’s decisions, so they make better decisions and execute better.

But the value of your data lies in your ability to communicate them right. Hence a focus on how you present and communicate your data is critical.

The more data you get access to, the more data you will have the opportunity to present.

Figuring out exactly what to present is the real task. Otherwise, the risk of you (and management) drowning in the overload of data and losing sight of the key factors that should drive decisions is immense.

Defining what to communicate, therefore, becomes your most important task. Gathering all your data and sending it forward to management is easy to do. But this has got nothing to do with building valuable financial insights.

However, filtering and selecting the correct strategic data and presenting it is, precisely, what you want to be doing to ensure you effectively present and visualize the important message your data is telling you (and your management).

An old-fashioned Excel Spreadsheet can be impossible for outsiders or non-financial professionals to understand. To be sure your message comes across, present your data so it is digestible for everyone.

Here Power BI (or any other visualization tool) is your friend!

You have to move away from the classic column layouts in Excel and think more creatively about how you present your data to management. Presenting data to your management in large Excel files will not benefit anyone.

You need to present data in a way that easily communicates the story the data is telling you (for your financial group reporting, Konsolidator can help you do this).

By now, you have probably realized that being only a number cruncher sitting behind your screen is no longer enough. You must seek out and talk to people in your organization to gather valuable insight about the business. Especially for SMEs, it is essential to facilitate this change during uncertain times, where real-time insights for what to do and why to do them are crucial for business survival.

Start with the beginning and build a data flow that delivers accurate financial statements.

And remember, the output of your data is only as good as the input, so data structure comes before anything else.

What are the most important points you should know about agile data integration and the value it can create for you and your financial team?

In a few minutes you will have learned exactly this!

When operating with an increasing amount of data, the need for several different software and systems increases. The need for faster financial insights based on valid high-quality data also increases. Especially in the uncertain and changing times we have experienced for the past year, it is more important than ever to present forecasts and recommendations to solve problems and keep your business going.

To stay relevant as a finance professional, you must deliver recommendations to influence management’s and board’s decisions. This can be achieved by automating the parts of your workflow where you are using a lot of time on manual processes and where the risk of errors is high.

When using multiple types of software and systems in your finance department, agile data integration becomes an interesting factor to look at when automating processes in the workflow.

Using agile data integration for handling, processing, and presenting financial data is a simple way to ensure a smooth automated workflow at the finance function. Data integrations come in many different forms. Some of the most common ones are Robotics Process Automation (RPA) and Application Programming Interface (API).

Use data integration to optimize the workflow and influence decisions 

In finance today we often talk about how to optimize the workflow in order to deliver faster real-time insights for management to base their decisions on. We want to work smarter to be more efficient and as a result gain time for the in-depth financial analysis which can improve our business. So we want to be efficient and fast but at the same time we also want to be able to trust our data and increase the data quality.

To do this there are 5 hot topics when talking about trends in the finance function 2021, we need to have our eyes open to:

        1. Big data: Big data involves a large volume of data from different sources,  handled by different software and people.

        2. RPA: Robotic Process Automation is all about letting robots take care of manual, tedious tasks to save time and minimize the risk of errors. 

        3. AI: Artificial Intelligence is manufactured intelligence demonstrated by machines. It is not seen so much in the finance function yet, but we foresee it will soon be a big part of the finance department as well.

        4. Machine Learning: Machine learning using machine power to estimate the future by creating forecasts.

        5. Visualization and communication: The role of finance professionals is changing, and it is becoming your job to communicate and present relevant recommendations based on realtime insights made from trustworthy, quality data.

Avoid drowning in data and communication overload  

As the finance department gets access to more and more data, it becomes increasingly important to structure all your data but communicate only the relevant parts. You must keep the big picture in mindotherwise you will get lost, overinformed, and confused. Data and communication overload will result in you confusing management and the board too, because they will be drowning in data. Instead of facilitating a faster and better decision-making process you will end up slowing it down. 

To avoid this overload, you have structure for your data so you know what data to present, how to present it to get your message across, and when to present it. Here, agile data integration between your systems will be a major advantage for you and your team. By using, for example, APIs or RPA to handle manual workflow processes when processing data, you free up time for cognitive and creative tasks like making in-depth financial analyses and recommendations based on your analysis. You also minimize the risk of errors when, for instance, moving data from one system to another.

It is from this perspective that implementing agile data integration into your workflow will be a differentiating factorOn a practical level, it means that you save timereduce the risk of errorsand increase the efficiency and flexibility of the workflow. It also means that you get to do the tasks that challenge you on a professional level and deliver results which can add great value to your company. 

4 steps to implement agile data integration in your finance function

1) The first and most important step to take when implementing agile data integration is simply to get started! 

Your agenda needs to have a plan for how you and your team can access and use more data faster to be the catalyst for faster and better decisions at your group.  

But how? You might ask.  

Start by slowly getting to know and use the tools and integration services you find interesting during your off-hours. The next time your manager is asking for a specific report, then show your manager how easily you managed to deliver it with the help of software and integrations. It might seem like a small thing to do but doing a little is better than not doing anything at all. Getting started on using agile technology is the one thing that can prevent you from lagging behind in the finance business. 

So, get going!

2) Step number two on the way to smooth and automated data integration is to be proactive.  

I can sometimes be frustrating in the beginning because there can be a lot of roadblocks and it can seem like you will never get to the finish line. But you should focus on the tasks you actually can do rather than the ones you can’t do at the moment.  

 For instance, focus on the skills you have at your department and take the lead on the tasks which can be done very quickly by you and your team. This apporach will get things done, as opposed to waiting for IT to create a set up of data integration between your software. This way, you will have control of the project and will be able to deliver results and move closer to your final goal. 

3) Step three is to begin with the end, so to say. Think of your end goal: What is it that you want to communicate? 

There are several ways to achieve your goal, but along the way, you need to consider: 

      • What should your future report look like in order to achieve your goal?
      • What tool should you use in order to get the look you want for communicating your data?
      • Which other tools are needed to communicate with your reporting tool? How can you ensure an agile flow of data from one system to another when trying to get a message across based on your data? 

4) Step four towards implementing and using data integration in your finance function is to put first things first. 

You must start by taking small steps and focusing on the tasks that you can do. But, as previously described, it is equally important to prioritize these tasks and the plan you have made to succeed.  

If the tasks necessary are not prioritized, othedaily tasks and deadlines will stop you from getting to the finish line. You will lag behind not only with your plan but also as a finance professional since you will be stuck in the same pattern while others embrace agile data integration and other workflow automation projects. 

To avoid ending up in this situation, it is important that you prioritize and follow your plan to ensure the implementation of agile data integration in your group. 

If you find it hard to plan and get started, then find some role models for how your reporting can look. Follow these role models, maybe talk to them to get inspired and exchange ideas – networking is gold in this kind of process. Look to bigger companies within your industryas they could be reporting something you would like to report too, but on a smaller scale.

There is no way around agile data integration 

The reality is that there is no way around agile data integration the modern finance function. Remember it is all about decision making and how to facilitate better and faster decisions supported by valid quality data. That is the overall outcome. We tend to look at all the data we gather and sometimes drown in it, which is why the big picture is so important to keep in mind.  

So ask yourself: What is the big picture at my business? 

When you know what it will take for you to get the bigger picture then convince your management this is the way to go through results. Start for yourself by, for instance, exploring how to get data from your ERP system to your consolidation or reporting system. Take small steps and when you have something worthy of showing, then present it to managementso they can see all the benefits of agile data integration and workflow automation. 

Would you like to see some real-life examples of agile data integrations and learn more about APIs?  Then click the link to watch the webinar, Seamless Data Integration for Finance Professionals. Or read more about how data agility is becoming a competitive advantage in finance 

One of the particular challenges around working with consolidated financial statements is having two sets of numbers to relate to.

  • One set of numbers for the consolidated financial statements
  • And another set of numbers for local financials.

In this blog we show you how to keep track of both and make sure you comply with both local accounting regimes and global financial standards.

Why do you have different set of numbers?

It may seem like a suspicious kind of accounting to have two sets of numbers, but let’s just clarify what we mean exactly: the basic accounting is obviously the same.

Debit and credit is the same in Germany, Denmark, Sweden – in fact, debit and credit is a global language, accepted and understood by accounting people across the world!

When you account for a sales transaction, a purchase of goods and services, or when you pay salaries to employees, this is pretty much done in the same manner across the globe.

But, when it comes to the accounting items, where a certain degree of judgement is involved, you will often find differences in the accounting guidelines from one country to the next.

Let us illustrate it with a few examples:

  • Depreciation of tangible fixed assets: you will often find that different countries set depreciation over different periods. Or, only allows certain depreciation methods.
  • Allow interest to be capitalized as a component of fixed assets or inventories.
  • Include financially leased assets in the balance sheet, or not.
  • Allow deferred tax assets to be recognized in the balance sheet, or not.

Of course, you have globally accepted and aligned accounting frameworks – IFRS, for example – which are used in a number of countries and ensures consistent reporting in the consolidated financial statements. IFRS would often be ‘the language’, in which you report the set of numbers used for consolidation. But that does not eliminate the challenge of different sets of numbers, because local entities still have to report local financial statements for statutory purposes, or as part of local tax regimes.

Memory is short – accounting is forever

Well, although you have different sets of numbers, it shouldn’t be that difficult.

Maybe you will have 8 to 10 deviations from one set of numbers to the other – a few different principles on depreciation, a deferred tax asset being recognized or de-recognized; something like that.

Not all that difficult.

So, why is it that carrying this forward is so tricky?

We have probably all tried to take over a spreadsheet from someone else and had to dissolve the numbers and sources they came from. In fact, just looking back at a spreadsheet you prepared yourself a year ago, trying to think of the reasons for numbers that went in there is troublesome!

Undoubtedly the main root causes for your problems comes from this:

  • Is the adjustment coming top-down or bottom-up?
    In consolidation, you occasionally re-value a local asset or a local liability on group level. A local asset impairment is reversed, or an accounting obligation is derecognized, as examples of this. Maybe these adjustments are ‘pushed down’ to local reporting, and the source for this could even be outside out of your own accounting circle. Maybe that’s why you don’t recognize the number.

  • Is the adjustment an amount or an allocation rule?
    e., are you completely removing an asset, because it should not be capitalized in your consolidated numbers – for instance a tax asset, which is not to be included in your consolidation numbers. Or, are you removing a 10% inter-company profit on year-end inventory from your numbers, but entered that as a number instead of a calculation within a spreadsheet?

  • Is the adjustment really a reclassification?
    Often, you reclassify or eliminate a few things, when you do you consolidation: intercompany sales and purchases are obvious examples, and the corresponding intercompany receivables and debts, of course. In your spreadsheet, those reclassifications may appear side by side with other adjustments and allocations, just to add to the complexity of it all….

Most of the information kept in short-term memory will be stored for approximately 20 to 30 seconds.
Yes, you clearly understood the reason for a deviation that was adjusted in your reported numbers or your consolidation spreadsheet, when you did it.

But a year from now?

Probably you should have entered a little more text in your spreadsheet, instead of going out to dinner when your consolidation finally matched up that late January evening last year.

How can you structure your work, so you don’t have to rely on your short-term memory?  

It might sound banal, but in the light of how complex consolidation is let this be your reminder that it takes more than a great memory to keep track of your numbers in a spreadsheet consolidation solution.

If you try to retain a phone number for just a few minutes your memory will be a great help, but if you try to recall the  same number a year from now it will be almost impossible. The same rule your can apply to your consolidation.

So, the number one thing you should do to help your memory is to structure your data, so you (and others) won’t have to rely on your memory alone. In other words stop trying to keep track of all your numbers in a spreadsheet solution and start looking for an actual consolidation tool that will help you clearly see which numbers came from which local source systems vs. adjustments made during the consolidation process.

Also, in a structured system you make your adjustments as formal journal entries, not just spreadsheet formulas – or even worse: just plain numbers in spreadsheet cells. The system makes sure you cannot post a one-legged entry – your debits and credits need to match, even in consolidation.

And remember, you still have to satisfy local requirements in accounting. Your local auditors still need to be satisfied, not just the group auditors.

If you are a CFO, Finance Manager or Controller in an SME’s, and do the consolidation just once a year it makes it even more difficult to remember those different sets of numbers, so for you a formalized structure is a must in order to avoid errors that come from spreadsheet formulas or plain numbers in spreadsheet cells.


Calculating the real impact of poor data in finance is the key to avoiding errors in future reporting. 

Even though many of us know that we risk making mistakes by leaving big decisions until the very last minute – we still do it. Many of you will recognize this from your personal life, but it certainly holds for many accounting decisions. Whether it is due to time pressure, overconfidence, too many tasks, insufficient hands, or other things, we often see that last-minute journal entries go wrong – even when experienced finance professionals are involved. But why is that?

In this blog, we investigate the answer to this question – and the answer also holds the key to avoiding errors in future reporting. 

Why is it always last-minute entries that go wrong?

Reporting from consolidated entities is often subject to multiple local controls. Your control framework – which is usually worked intensely on with the help of skilled auditors and consultants – requires all journal entries to be documented, approved, tested, and audited. Also, local reporting often forms the basis for local KPIs, bonus schemes, and balanced scorecards. In itself, this requires due diligence in reporting (not saying, of course, that you cannot find errors and omissions in the history of accounting, even down to accounting performed in local sub- or sub-sub-entities). However, the final accounting adjustments, made on a group level, are often handled by a select group of employees.

And this group of employees is often crucial in finalizing the financial statements for the year. It probably has the company CFO in it, as an example, who may be the only person in the company knowing whether the company: 

  • wants to restructure a division, 
  • close down a factory, 
  • cease an operation, 
  • Or other

This group of people is the one to assess a potential impairment. As a result, the final adjustments may not be ready until the very last minute. Furthermore, they may be hand-carried through the books by the same people who prepare the adjustments. But if this is the case, there should be processes that ensure a fast and accurate approach to avoid the risk of errors. The 1-10-100 rule illustrates the importance of this.

Applying the 1-10-100 rule to your excel spreadsheets

Excel spreadsheets are great for many things but not for audit trails! Often, we mishandle these last-minute adjustments in the spreadsheets.

Below you might recognize some of the three classic examples of easy mistakes that most of us have (unintendedly) come across at some point in our careers as finance professionals:

1) Formulas are overwritten by a value. The CFO assessed the value of the obligation, and it is quicker to book it right there and then in the consolidation spreadsheet. You will worry about that entry in the accounting system some other day.

2) Cells, rows, or lines are added or deleted, which further down the sheet results in incorrect totals and subtotals.

3) A rule to transform a source value to a result is not documented. The entered currency rate between the local entity reporting currency and the consolidation currency is just a number in the spreadsheet cells.

With these (typical) errors in mind, let us consider why the 1-10-100 rule is relevant.

In 1992, George Laboviiz and Yu Sang Chang developed the concept of the 1-10-100 rule. The rule suggests that correcting errors is more costly than preventing them. In fact, moving from the prevention of an error to detection increases the cost of a mistake by a factor of 10. And, if you move on to correction – or failure – that factor is 100! Relevant for everyone in finance today who spends more time correcting errors than preventing them. Even more so due to the digital tools, we have available to ensure data quality. In truth, you know it, and we know it; it all comes downs to data quality when delivering reporting. 

The three phases of the 1-10-100 rule

Let’s illustrate the rule in detail. The rule has three phases, each explaining the cost of maintaining data quality.

In phase 1, the “prevention” phase, the cost of errors is $1.

Following this rule, it will cost you $1 to verify accurate data at the capture point. It is the least expensive and, by far, the most effective way of ensuring you capture clean and precise data. At this point, your data originates, and haven’t influenced other data yet, e.g., your subsidiary’s wrong balance sheet hasn’t affected the group’s result. Therefore, it makes sense that controlling your data before it enters the report will always be the preferable and less expensive choice.

In phase 2, the “correction” phase, $1 has increased exponentially to $10.

Now your $1 has increased exponentially to $10. Why? The $10 represents the increased cost of incorrect data on your business the longer you leave it. More specifically, if one subsidiary has delivered a wrong number, this data will feed into the balance, which then will be part of the group’s results – suddenly, you risk providing an incorrect result. And it will take much longer to find and correct the mistake, ergo the high increase.

In phase 3, the “failure” phase, the $10 has increased tenfold to $100.

If you do nothing and do not catch the error, the cost increases to $100. Furthermore, you risk delivering data filled with unintended mistakes. If you do not correct poor data in time, it will affect your overall result. And honestly, it happens way too often in finance reports – whether you recognize it or your colleague can. But the time and money you use to correct and prevent it from happening again have suddenly increased drastically too.

Poor data leads to poor decisions

While we can all agree that it is a financial (and time-consuming) problem to correct poor data, the biggest issue with poor data is that it leads to poor decisions. So, do your company (and yourself) a favour and find a method that supports accurate data processing. A method that won’t let you easily commit those manual errors we are often prone to make, especially when we are in a hurry and lack a formalized and structured data processing method.

Studies suggest that almost 9 out of 10 spreadsheets contain errors. And by errors, we mean unintended actions with negative consequences or failing to achieve the desired outcome. Of course, we are all convinced that the errors do not apply to our own Excel spreadsheets – but with 9 out of 10 spreadsheets containing errors, the risk is high!

Nobody is perfect, and there is always a risk when processes involve humans.

So, the takeaway is to learn to identify those processes where errors can occur and create new processes around them, which will help you avoid those errors next time you are in a hurry to complete, e.g., your consolidation. 

Right now, start by taking a good hard look at your Excel solution and evaluate if it is the tool you should use for complex reporting like your consolidation.

Furthermore, your auditors will also investigate your Excel sheets in a few weeks or months. They will verify that you can track all the consolidation amounts back to their source, and their focus will also be on those last-minute journal entries.  

Preventing errors with a formalized structure

We, of course, recommend using consolidation software to avoid unintendedly making mistakes in your last-minute journal entries. The advantages of an actual system vs. a spreadsheet solution are many. But the particular advantage for the purpose of documenting those important journal entries is the formalized structure a consolidation software gives you.

Here are just a few examples:

  • A system requires you to enter a journal entry in a standardized manner.
  • A system will provide you – and your auditors – with an audit trail.
  • A system makes sure you cannot post a one-legged entry.
  • A system (often) requires you to ask experienced colleagues to perform the entry because of segregated duties between employees.
  • A system calculates all entries and does not skip cells or columns.

Even for SMEs, we believe that the advantages of consolidation software outweigh the costs. If you have just a few consolidated entities in your group, chances are that the consolidation process is not embedded in your daily routines – every consolidation is a new experience, and you have to start all over again. Here, a consolidation software solution will give you a head start.

So, if you have ever made a wrong call due to a last-minute decision, don’t take this habit into your accounting manners. Get started on a formalized consolidation process and stop making errors in the last-minute journal entries.

Get a quick preview of how your consolidation can look with a formalized structure in Konsolidator

Creating the annual report is always a big event in the finance department. Often it means long hours, lots of takeout meals and good times with colleagues. However, while finance professionals might find it interesting perhaps now is a good time to question its relevance in the world, we live in today.

Our stakeholders want fast, reliable, and accurate information they can trust to help them make better decisions. And it should also be forward looking. The historical numbers they know, and they are already factored into their decision-making.

So, what are all those long hours good for? 

Let us examine further the use of the annual report not least for smaller and medium sized companies. We should also consider the internal company perspective as well as the external investor/stakeholder perspective.

The annual report and its many uses

For large companies, the annual report would mostly be considered a compliance and regulatory requirement not least if it is not a listed company. The report rarely produces any new information for internal stakeholders and is considered a non-event by most stakeholders when published. Why?

They are already discussing February performance of the next year (assuming you follow a calendar year). The report might make some waves with investors in listed companies but even here they are rarely caught by surprise about historic details. Let us instead turn to SMVs and consider their use of the annual report.

For many smaller companies, the annual report might be the only time of the year that they do a real hard close. They likely have a good idea about their P&L and working capital during the year but not all other details. That already makes the annual report an important process in reviewing the performance and worth of the company.

The internal perspective

For Finance this an opportunity to scrutinize the numbers in greater details. Finance can ensure all the assessments made during the year to make up a P&L gave a correct picture of the company’s performance. Moreover, the balance sheet including provisions and tax should be assessed with a potential impact on the P&L.

It is also a good opportunity to close the year having some performance talks with department heads and management. Finally, it is the basis on which management will go to the board and evaluate the year. Was the budget met? Did management live up to its expectations? What significant assessments have been made on provisions and accruals, etc. It might be outdated information but, in some way, it is still the first time that many stakeholders in the company get a full overview of the performance for the year.

The external perspective

There are more eyes looking at your company than you realize. Public authorities, competitors, suppliers, customers, potential buyers, etc. For all non-listed companies, the only way they can get good financial information on your company is through your annual report. This needs to be submitted to the central business register and will usually be publicly available for interested parties.

This in turn forms the basis for many different activities such as credit reports that can be bought, key figures comparison to competitors, valuation by potential buyers, etc. Unless you go beyond regulatory requirements and publish your annual report and additional information yourself this is the only way these stakeholders can get access to your financials. Hence, it is in your best interest to do a proper job and create high quality financials. They will go a long way to establishing trust around your company’s activities.

Why you should go beyond the minimum requirements

At the end of the day, there is a lot of information produced in your company that will be more helpful for decision-making than the annual report though. Hence, you should carefully consider the benefits of doing more than the minimum requirement. Also, you should consider if there are ways you can optimize the process. Sure, it is cozy to have pizzas with co-workers and it might even be fun to work long hours for a shorter period. Still, why not spend your time more productively and work on a value-adding analysis or discuss with business stakeholders how to improve performance for March?

Therefore, it is recommended to review your processes and see what can be done smarter and find work processes that can be eliminated or automated. In addition, consider if there are any tools that can help you close the books and the annual report faster. The annual report is still a relevant product in 2020 but if processes in the workflow can be done smarter and faster while delivering a more accurate output – wouldn’t you prefer to do so?

If yes, then click here and download Konsolidators top 5 tips for preparing your annual report and gain valuable tips on how to save time while delivering and error free annual report at deadline.

Authors:
Anders Lui-Lindberg, Partner, COO & CMO at CEO at Business Partnering Institute